About

Creating the project: Data, sources, and positionality

Image of “Maru” by Gerard Tsutakawa at the University of Washington, Tacoma.

free simple site templates
Mobirise

State Art Collection

The dataset used in creating this project was the Washington State Art Collection. The dataset is available via data.WA.gov, the open data portal for the State of Washington. The link to the state art collection is: https://data.wa.gov/Education/State-Art-Collection/yfjt-f6ae  

Dataset

There were a few, small steps in preparing the data for analysis. Working from the full data set of the collection, I filtered the column 'Artwork Site' by 'College' and 'University' and saved this filtered list as the dataset that I would use for analysis. In looking at the full list of colleges and universities represented in the database, I noticed there was a middle and a high school that had 'University' in their school name, I removed these entries from the data.

Additionally, I reached out to the Washington State Arts Commission to clarify the meaning of the 'Date' column and learned that it referred to either the date the artwork was installed or the date the work was created (if it was created prior to being acquired by the state). I learned that the year represented in the column 'ID Number' - where entries were formatting as 'WSAC1977.025.000' - indicated the year of acquisition for the state collection. I used OpenRefine to separate this column into multiple columns, separated after WSAC and each period, I then removed all the columns except for the one containing the year. This column became the year of acquisition.

In mapping the latitude and longitude coordinates, there were two art pieces whose longitude coordinates were missing a period, making them a value in the hundreds of thousands and impossible to map. I added a decimal place after the third digit, to generate a coordinate that matched the others in the dataset and would come up as in the state of Washington. I used Excel for most of my data cleaning and manipulation, creating additional sheets to count the number of unique institutions represented and how many pieces were at each, for example.

Finally, information about the artists' educational background was gathered from a range of sources; including, the ArtsWA database, artist, collective, and gallery websites, artist Wikipedia pages, obituaries, and newspaper articles.
Data Visualizations

The data visualizations for this project were created using Tableau Public, Flourish, Sutori, and Mapchart.net. I used Tableau Public to create the density map of the artwork pieces, the line graph showing how many pieces were acquired by each institution in each year, as well as the visualizations showing the proportions of artwork and artists affiliated with various institutions. I used Flourish to create the line chart showing acquisitions over time as well as a bubble chart that I used to show the shift towards site-specific, commissioned pieces. The latter chart was initially created in Excel and then I shifted to Flourish to be able to embed the chart with more interactive features (i.e. if you hover over any of the bubbles, information about that point of data appears). I used Mapchart to create a quick map showing the states with active and inactive percent for art programs.

Finally, I used Sutori to create the embedded timeline of percent for arts programs in the United States. The majority of the data for the timeline came from a list of programs maintained by the National Assembly of State Art Agencies as well as each state program's website (often the site for the local arts commission or council). I added in information about two states no longer on the list: North Carolina and Wisconsin, but was unable to find information about Michigan's old percent for art program.

Limitations

White the WSAC dataset is a rich source of information about the art at Washington's public colleges and institutions, the data for this project also has limitations that affected the interpretation and presentation of this project

  • There is limited information about the artists' background in the dataset, though the State Art Commission's online database has some information about artists' background, including their year of birth, chosen media and style of art, and sometimes educational information.
  • Although there are coordinates (latitude / longitude) for each piece in the collection, there aren't publicly available campus map data layers on which to map these coordinates.
  • There is limited information about the placement of art at the artwork site (outdoors / indoors) as well as information indicating the relationship between pieces when multiple pieces by the same artist are purchased for the same site in the same year. These pieces may be considered part of one larger piece or series, or separate pieces that were jointly commissioned.
  • There is a small number of pieces without a creation date (n.d.).

Researcher Positionality

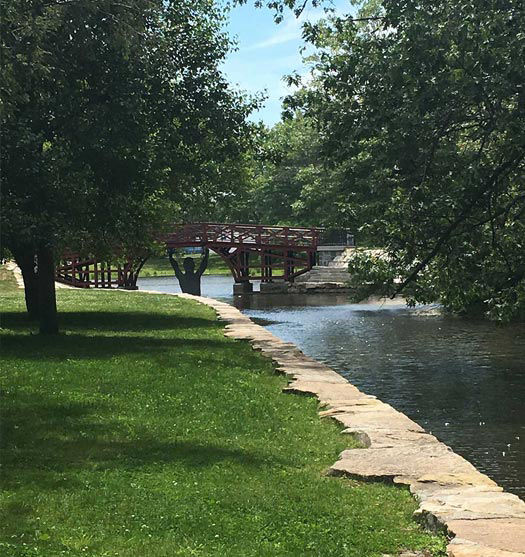
This perspective I take in this project, looking at public art through the specific context of higher education, is informed by my academic and research background in the field of higher education. Additionally, I come to the project as someone who has volunteered and supported the work of Art in the Park, Worcester since its first exhibit in 2008. AIP Worcester is a large-scale public art exhibit at historic Elm Park, in Worcester, Massachusetts. My interest in public art has been shaped by this experience with public art in my hometown during my college years.

Mobirise

References

  • Boase, T. (1955). An Oxford College and the Gothic Revival. Journal of the Warburg and Courtauld Institutes, 18(3/4), 145-188. doi:10.2307/750178
  • Bowen, H. R. (1977). Investment in learning: The individual and social value of American higher education. San Francisco, CA: Jossey-Bass.
  • Bowman, A. A. R. (2011). Beyond the ivory tower: in search of a new form for campus community-relationships. Boston, MA: Massachusetts Institute of Technology.
  • Clark-Langager, S. A. (2002). Sculpture in place: A campus as site. Bellingham: Western Washington University.
  • Diner, S. J. (2017). Universities and their cities. Baltimore, MD: Johns Hopkins University Press. 
  • Hamilton, R. (2013, Oct. 24). If You Build It on Public University Campuses, 1 Percent Must Be Public Art. The Texas Tribune. Retrieved from https://www.nytimes.com/2013/10/25/us/if-you-build-it-on-public-university-campuses-1-percent-must-be-public-art.html
  • Gumprecht, B. (2007). The campus as a public space in the American college town. Journal of Historical Geography, 33(1), 72-103.
  • Kiefer, K. (2006). Art on campus 101: Aesthetics, identity, and lessons learned. Public Art Review, 17(2), 16.
  • Knight, B. (2016). Placemaking: Attracting and retaining today's students. Community College Journal, 87(2), 8.
  • North Carolina Arts Council. (n.d.). Creating place: North Carolina's artworks for state buildings. Retrieved from http://cdm16062.contentdm.oclc.org/cdm/ref/collection/p249901coll22/id/30199
  • Patton, G. (1967). American Collegiate Gothic: a phase of university architectural development. The Journal of Higher Education, 38(1), 1-8.
  • Paulsen, K. (2010). Placemaking. In R. Hutchison (Ed.), Encyclopedia of urban studies (pp. 600-603). Thousand Oaks, CA: SAGE Publications, Inc. doi: 10.4135/9781412971973.n214
  • Thelin, J. R. (2011). The history of American higher education. Baltimore, MD: Johns Hopkins University Press.
  • Turnbull, David. Maps Are Territories: Science Is an Atlas: A Portfolio of Exhibits. University of Chicago Press ed. Chicago: University of Chicago Press, 1993. Retrieved from http://territories.indigenousknowledge.org/
  • Walljasper, J. (2008, Dec. 31). Big plans on campus. Project for Public Spaces. Retrieved from https://www.pps.org/article/campusbulletin
  • Washington State Arts Commission. (n.d.). Strategic Plan 2015-2017. Retreived from https://www.arts.wa.gov/media/dynamic/docs/FINAL%20Strategic%20Plan%202015-17.pdf